Analytical Reasoning with 'What If' Scenarios
Tags:
One of the most insightful blogs I’ve ever read was Tim Vieira’s post on “Counterfactual Reasoning and Learning from Logged Data”; I highly recommend it to anyone interested in reinforcement learning and policy optimization techniques. That said, with this post here, I hope to distill some wisdom that analyst and app developers can use to improve their platform’s engagement.
For those unfamiliar with the concept of counterfactuals, you can think of them as data that would have arisen under an alternative scenario i.e. “what if scenarios”. By the end of this read I’m wishful that you’ll have a reasonable foundation for how one can go about thinking in terms of counterfactuals, inspiring you to reason about your system from a different perspective and experiment a little with some of your metrics and mappings.
Reasoning about your data
In order to develop a sense of reasoning with counterfactuals we have to share an understanding of the type of data we’re applying our logic onto. Note, what I outline below is just one method of constructing counterfactuals, many methods exists and it is an active area of research.
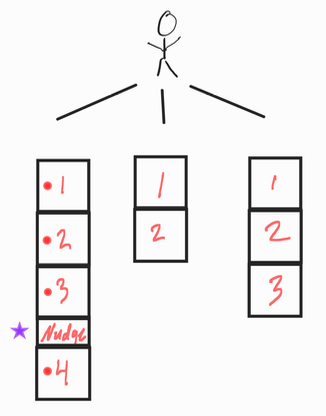
Now, say you maintain a content feed where a user can scroll $N$ slots. And let’s imagine that for some set spacing, $S$, you inject a “nudge” to jump to a different part of the platform, say, every 3 cards you “nudge” the user to go elsewhere. Some users will scroll past it, click it, never see it, or never even scroll depending on how your feed is structured.
With a bit clean up, your logged data will have the format of ’events’ as integers interspersed with “nudge” instances; in the diagram below squares represent “content slots” for ’events’ and the “nudge” component is labeled with a purple star.
The Logged Data
Given this data, if you’ve made your feed flexible and configurable then you can imagine this instance of logged data is just ONE set of information from your users; just imagine all the counterfactual scenarios you COULD have recorded data for IF the instance spacing, $S$, between your “nudges” were different.
What if your “nudge” instance spacing shrank, started at a different slot, had staggard spacing? With your historical data, and assuming* your analytics for CTRs are constant, mapping these counterfactual scenarios would lead to different counts of “nudges” and overall counts of engagements on your platform.
The nifty thing about these observed events under the historical spacing is that we can easily map those events into these counterfactual scenarios with a clever mapping!
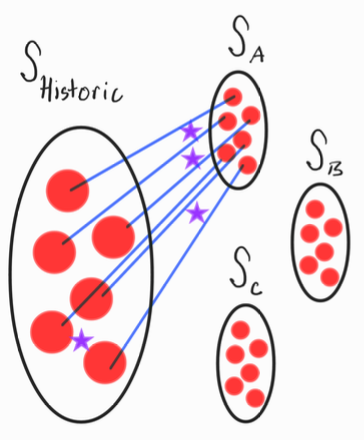
A Counterfactual Mapping
While the details for generating counterfactual mappings differ depending on
what scenarios you’re considering and your system, you can see in the diagram below an infinite number
of counterfactual scenarios are possible. You simply have to think in terms of what is the
immutable set of information in a configurable platform. That is, ’events’ are the constant set
and new mappings of “nudges” can be create by attaching “nudge” instances inbetween events
at different configurations i.e. changing your instance spacing, $S$.
This clever mapping is a nifty perspective that enables counterfactual reasoning. With it you can set up a slew of testable hypothesis for maximizing your platforms engagement; just think, “what if” we put “nudges” here, would that placement even be worth the experimentation time, all else constant? That said, don’t forgot to factor in different user segements.
Concluding Remarks
While it may seem like counterfactual scenarios are a space of inifinite possiblities, any good data practitioner would consider the asssumptions we made generating these counterfatual analytics.
For one, a “constant CTR” in a counterfactual space may be implausible, however, this assumption gives you a hypothesis which you can A/B test and truly assess the limits of your systems.
I hope you enjoyed the read and welcome to the world of counterfactual reasoning!!!
Other useful links
- Bouttou et al.’s fantastic arxiv read; this really drives home the importance of having a structural causal model for your system to experiment with.